Platform architecture
Cyberphiz has developed its architecture specifically at the intersection of cyber-physical risk, industrial safety, and causal reasoning. The Cyberphiz platform embodies many of the core principles associated to neuro-symbolic AI and agent-based industrial workflows:
-
Graph-based digital twins that model the relationships between physical assets, control systems, safety barriers, and digital dependencies.
-
Physics-informed validation that distinguishes between statistical anomalies and genuine physical risk.
-
Probabilistic loss models that quantify risk with explicit uncertainty, grounded in engineering physics rather than historical proxy data.
-
Agentic investigation capabilities that reconstruct causal chains from trigger to consequence with full auditability.
-
Continuous risk intelligence that replaces annual snapshots with dynamic, real-time risk assessment.
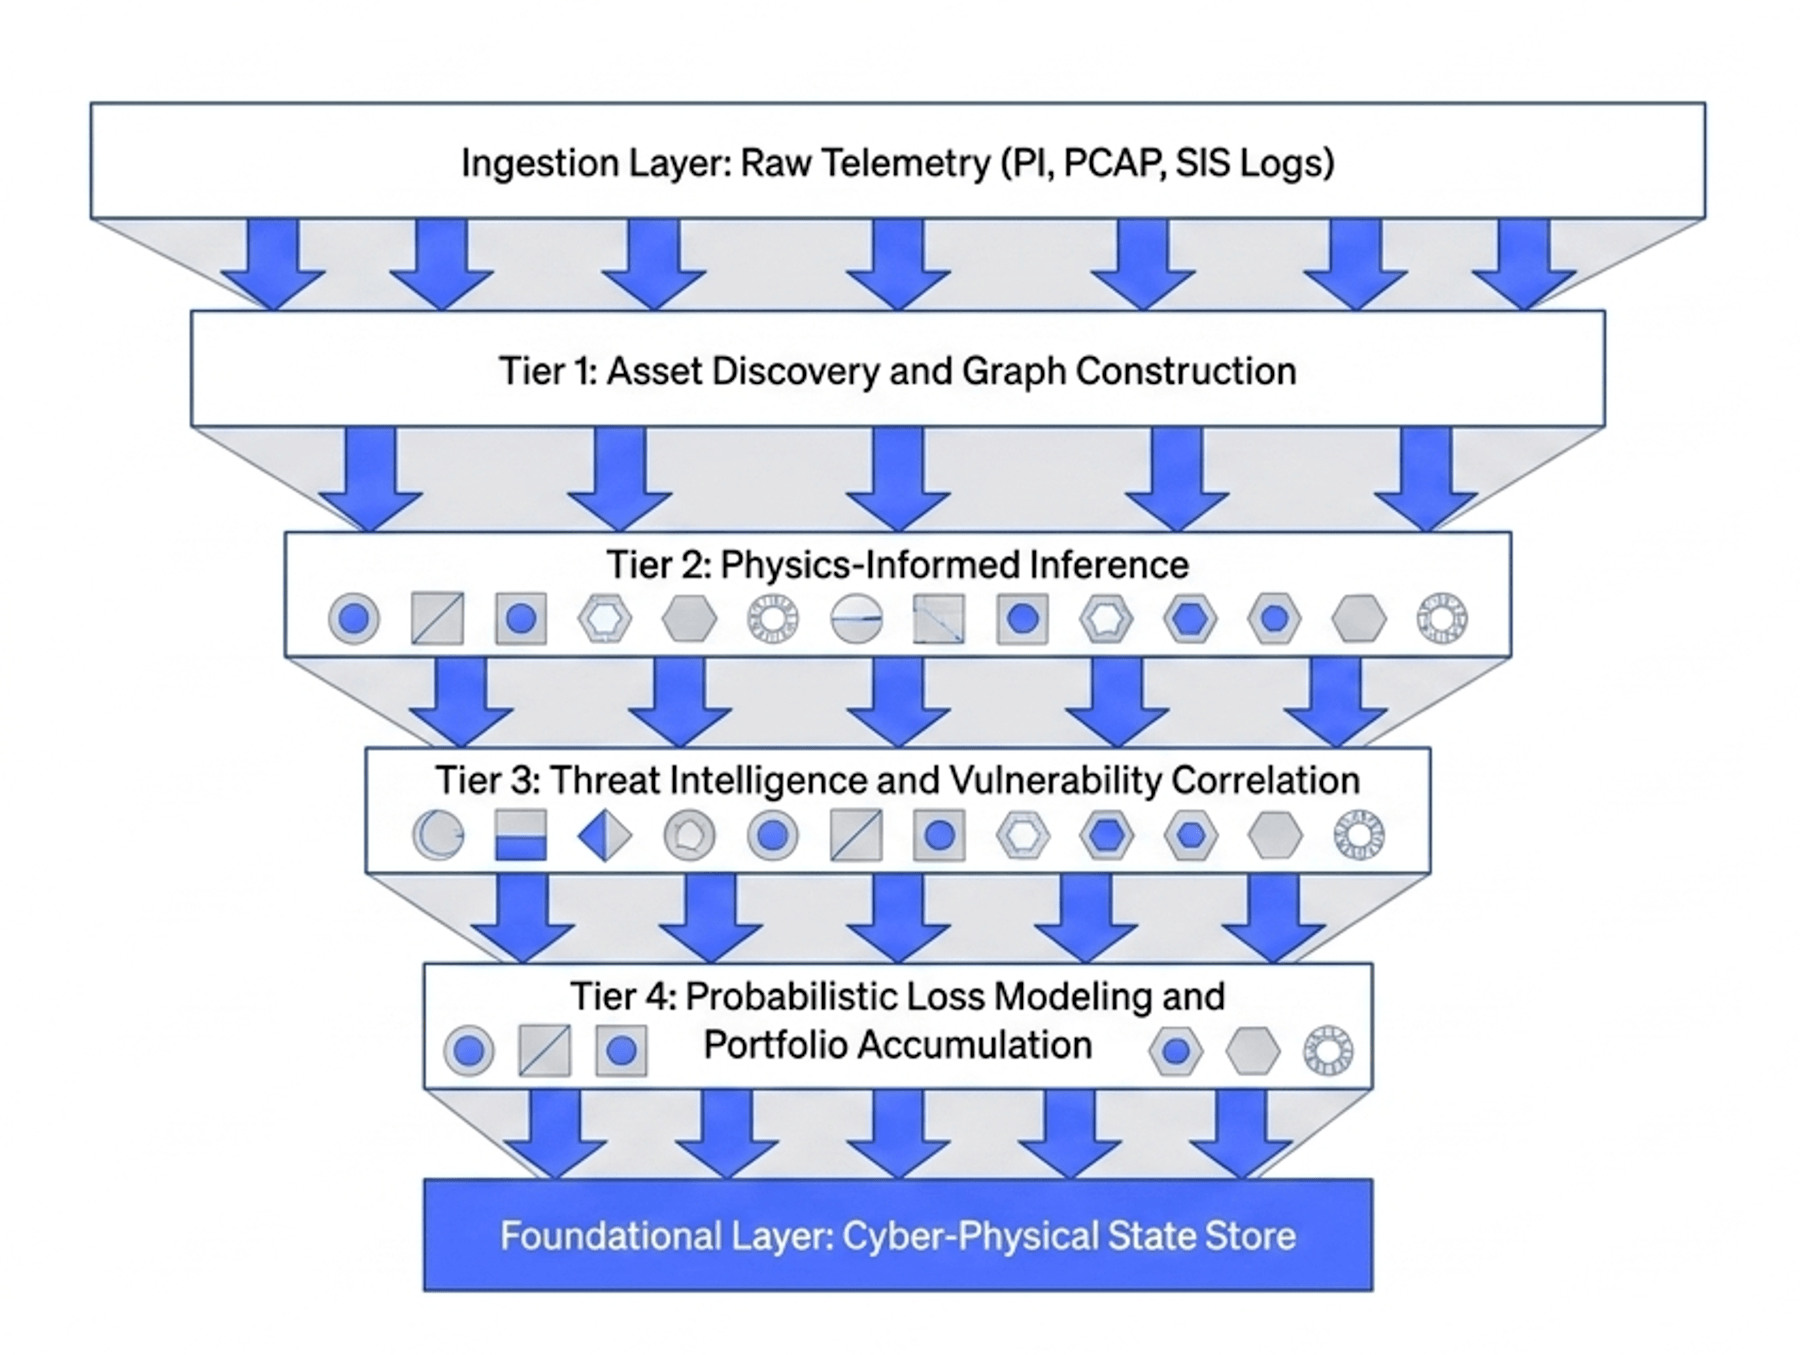
4 High-level flow
- Telemetry and event ingestion: Collect metrics from sensors, PLCs, SCADA, historians, agents, maintenance systems, threat intelligence, and environmental feeds.
- Semantic normalization: Bind every metric to an asset, variable, unit, timestamp, zone, conduit, topology path, authority scope, and provenance record.
- Digital Twin State Store: Store validated, versioned, time-indexed state features that represent the operational memory of the twin.
- Latent state inference: Use observation functions, physics modules, Bayesian filters, PDE solvers, physics-informed neural networks, or surrogate models to infer hidden physical variables.
- Residual and admissibility engine: Compare latent states against physical laws, temporal continuity, operating envelopes, material limits, and cross-sensor expectations.
- Risk graph and failure mode evaluator: Translate residuals into asset-specific failure probabilities and consequence pathways.
- Edge guardrails and response: Quarantine invalid data, raise FDIA or model-drift alerts, block unsafe commands, recommend safe-state actions, or trigger independent safety intervention.
- Forensic and assurance layer: Preserve evidence, reconstruct incident timelines, explain causal propagation, and update risk models after review.
Platform Components and Functional Logic
The TSST platform is organized around a set of functional components that work together to transform user requests, operational data, industrial context, and system events into governed digital services. Each component has a distinct responsibility, but the platform value comes from the way these components exchange context, validate actions, and preserve traceability across the full workflow.
Semantic and Configuration Layer
The semantic and configuration layer defines the meaning of platform objects, relationships, rules, and reusable components. It provides a consistent vocabulary for assets, signals, models, workflows, permissions, and operational concepts. Functionally, this layer allows the platform to interpret data and actions consistently across modules, reducing hard-coded logic and enabling more dynamic configuration of workflows, tools, schemas, and client-specific behavior.
Digital Twin and Knowledge Graph
The digital twin and knowledge graph represent the structure of the industrial or operational environment. This component stores assets, equipment relationships, sensors, control loops, dependencies, zones, and other contextual relationships. Its functional logic supports topology queries, dependency tracing, impact analysis, and context-aware decision-making. It allows services and agents to understand not only that an event occurred, but where it occurred and how it may propagate through the system.
State Store
The telemetry and feature layer provides observations about system state. It manages raw signals, normalized time series, derived indicators, residuals, anomaly flags, and reusable data products. Functionally, it acts as the platform’s perception layer: services, analytics, and agents use it to compare current behavior against normal behavior, detect deviations, generate hypotheses, and support reporting or operational monitoring.
Analytics, Physics, and Model Execution
The analytics and model execution layer runs deterministic rules, statistical models, physics solvers, simulations, and other analytical functions. Its purpose is to validate hypotheses and compute outputs that cannot be derived from raw data alone. In industrial use cases, this may include flow balance checks, pressure-drop calculations, thermal models, residual computation, or scenario simulation. This layer gives the platform a mechanism for functional reasoning based on domain logic rather than simple data retrieval.
Guardrail, Policy, and Decision Logic
The guardrail and policy layer evaluates whether observed or proposed behavior remains within allowed operational boundaries. It applies thresholds, policy rules, residual limits, authorization constraints, and escalation logic. Functionally, it separates detection, recommendation, warning, and blocking decisions so that higher-risk actions can be constrained, audited, or routed for human approval before execution.
Integration, Eventing, and Messaging
The integration and eventing components connect TSST to external systems and internal asynchronous workflows. APIs, connectors, queues, and event streams allow the platform to receive telemetry, call enterprise systems, publish notifications, trigger downstream processing, and coordinate distributed services. This component provides the functional backbone for real-time processing and loose coupling between platform modules.
Agent Runtime and Capability Registry
Where agentic capabilities are used, the agent runtime manages planning, tool invocation, memory, and reasoning traces. The capability registry exposes approved tools, data resources, models, and knowledge sources that an agent or service can use. Functional logic remains bounded: agents discover capabilities, call authorized tools, evaluate results, and produce explanations, while governance rules determine what they are allowed to read, compute, recommend, or execute.
Audit, Evidence, and Observability
The audit and observability components capture what happened across the platform: user actions, service calls, tool executions, inputs, outputs, state changes, errors, and operational metrics. Functionally, this creates the evidence chain required for troubleshooting, compliance, incident investigation, and continuous improvement. It also allows support teams to monitor platform health and understand how workflows behave in production.